In the world of online advertising, Google AdSense stands out as one of the most popular and effective ways for website owners to monetise their content. However, simply running ads on your site isn’t enough. To truly maximise your earnings, it’s essential to understand how to analyse and interpret the performance reports provided by AdSense. These reports offer a wealth of information that can help you optimise your ad placements, improve user experience, and ultimately, boost your revenue.
But diving into AdSense reports can feel a bit like trying to decode a complex puzzle. With so many metrics and data points, it’s easy to get overwhelmed. That’s why having a clear strategy for analysing these reports is crucial. By breaking down the key metrics, customising reports to suit your needs, and understanding the nuances of your audience’s behaviour, you can turn data into actionable insights.
In this guide, we’ll walk you through the process of analysing and interpreting AdSense performance reports step by step. Whether you’re a seasoned webmaster or a beginner, this article will provide you with the tools and knowledge needed to make the most out of your AdSense data. So, let’s dive in and start unlocking the secrets behind your AdSense performance.

Getting Started with AdSense Reports
Accessing Your AdSense Account
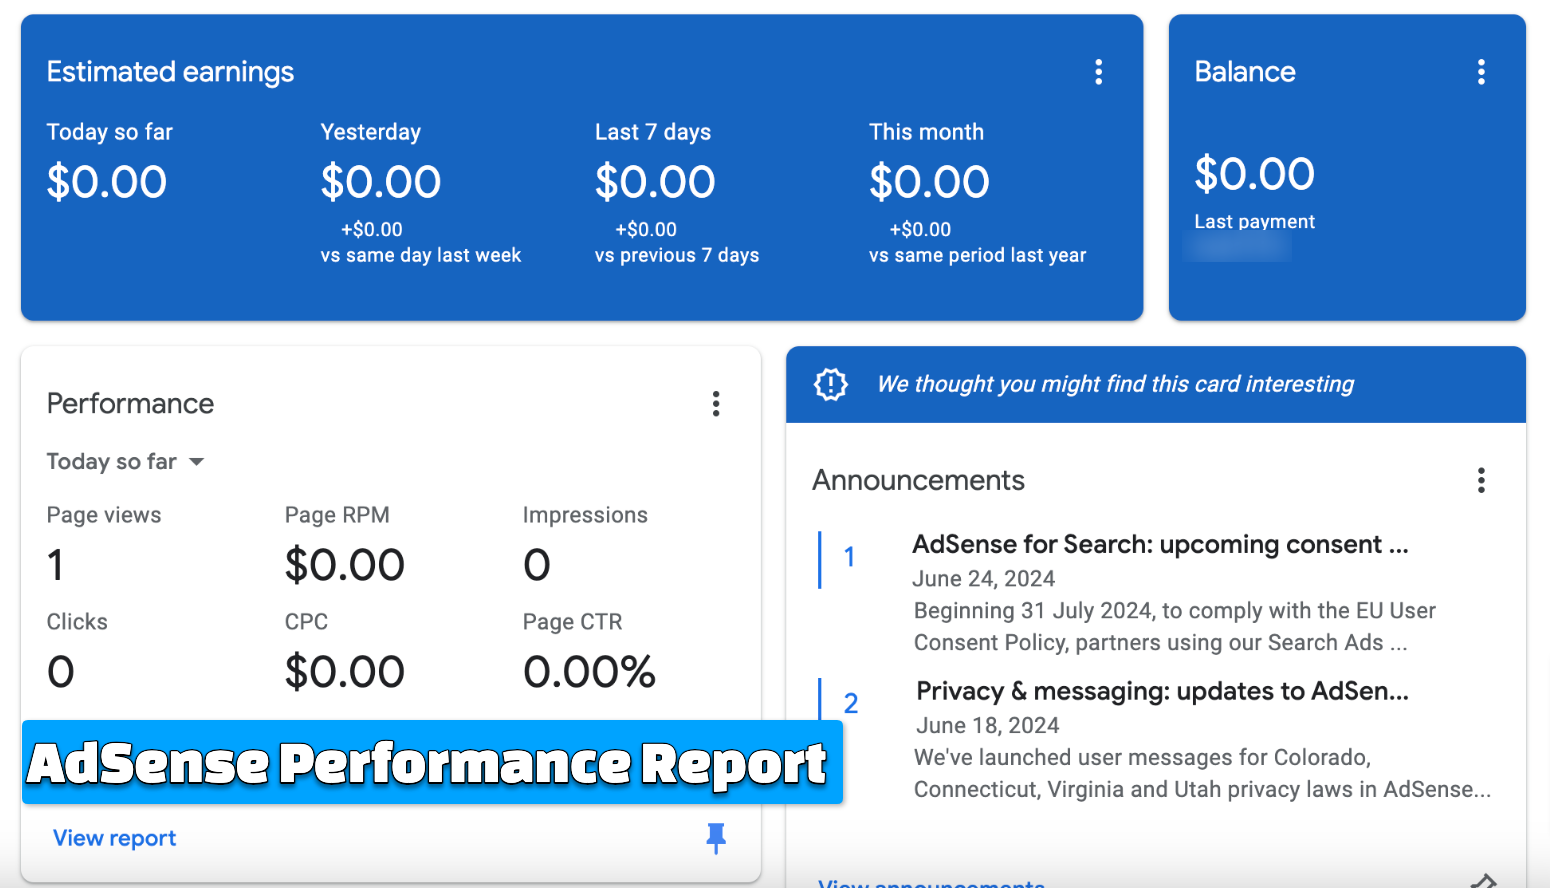
The first step to analysing your AdSense performance is accessing your account. Log in to your AdSense dashboard using your Google credentials. Once you’re in, you’ll see an overview of your earnings, performance, and other key metrics.
Navigating the AdSense Dashboard
The AdSense dashboard is your command centre. Here, you can find various reports that give insights into different aspects of your ad performance. Familiarise yourself with the layout and take note of the key sections such as Home, Reports, and Optimisation. Each section provides specific data that can help you understand how your ads are performing.
Also, Read – How to Utilise Pinterest for Driving Website Traffic
Key Metrics in AdSense Reports
Click-Through Rate (CTR)
Click-Through Rate (CTR) is one of the most important metrics in AdSense. It measures the percentage of ad impressions that result in clicks. A high CTR indicates that your ads are engaging and relevant to your audience. To calculate CTR, divide the number of clicks by the number of impressions and multiply by 100.
Cost Per Click (CPC)
Cost Per Click (CPC) represents the amount you earn each time a user clicks on an ad. This metric varies depending on the ad’s content, the advertiser’s bid, and other factors. Understanding CPC can help you identify which ads are most profitable and adjust your strategy accordingly.
Page Views and Impressions
Page views and impressions give you an idea of how often your site and ads are being seen. Page views refer to the number of times a page containing ads is viewed, while impressions count the number of times an ad is displayed. Monitoring these metrics can help you gauge your site’s traffic and the visibility of your ads.
Revenue and Earnings
Revenue and earnings metrics show you how much money you’re making from AdSense. This includes total earnings, estimated earnings, and finalised earnings. Keeping an eye on these figures helps you track your progress and set realistic financial goals.
Customising AdSense Reports
Setting Up Custom Reports
AdSense allows you to create custom reports tailored to your specific needs. To do this, go to the Reports section and select Custom Reports. Here, you can choose the metrics you want to track, the date range, and how you want the data to be displayed. Custom reports provide a focused view of the information that matters most to you.
Using Filters and Segments
Filters and segments are powerful tools for drilling down into your data. Filters let you exclude or include specific data points, while segments break down your data into more manageable chunks. For example, you can filter by ad unit, device type, or geographical location to get a clearer picture of your performance.
Scheduling Regular Reports
Consistency is key when it comes to analysing AdSense data. Schedule regular reports to stay on top of your performance. You can set up daily, weekly, or monthly reports that are automatically sent to your email. Regular monitoring helps you identify trends and make timely adjustments.
Analysing Traffic Sources
Direct vs. Organic Traffic
Understanding where your traffic is coming from is crucial for optimising your ad performance. Direct traffic refers to visitors who type your URL directly into their browser, while organic traffic comes from search engines. Analysing these sources helps you understand your audience’s behaviour and tailor your content and ads accordingly.
Referrals and Social Media Impact
Referrals are visitors who come to your site from other websites. Social media platforms like Facebook, Twitter, and LinkedIn can also drive significant traffic. By tracking referral and social media sources, you can identify which channels are most effective and focus your efforts on those that yield the best results.
Geographical Breakdown
Knowing where your audience is located can provide valuable insights into their preferences and behaviours. AdSense reports offer a geographical breakdown of your traffic, showing you which countries or regions generate the most views and clicks. This information can help you tailor your content and ads to better suit your audience’s needs.
Evaluating Ad Performance
Ad Unit Analysis
Ad unit analysis involves examining the performance of individual ad units on your site. Look at metrics such as CTR, CPC, and revenue for each ad unit to determine which ones are performing well and which ones need improvement. This analysis can help you optimise your ad placements for maximum effectiveness.
Size and Placement Effectiveness
The size and placement of your ads can significantly impact their performance. Larger ads tend to attract more attention, but they can also disrupt the user experience if not placed correctly. Experiment with different ad sizes and placements to find the optimal balance between visibility and user experience.
Ad Format Comparison
AdSense offers various ad formats, including text ads, display ads, and video ads. Each format has its strengths and weaknesses, and their performance can vary depending on your audience and content. Compare the performance of different ad formats to determine which ones work best for your site.
Also, Read – Maximising Your Reach on Facebook: Strategies for Effective Marketing
Understanding Audience Behaviour
Visitor Demographics
Knowing who your audience is can help you create more targeted and relevant ads. AdSense reports provide demographic information such as age, gender, and interests. Use this data to tailor your content and ads to better resonate with your audience.
Device Usage Insights
In today’s mobile-first world, understanding how your audience accesses your site is crucial. AdSense reports show you the breakdown of traffic by device type, including desktop, mobile, and tablet. Use this information to optimise your site and ads for different devices, ensuring a seamless user experience across all platforms.
Time on Site and Bounce Rates
Time on site and bounce rates are indicators of how engaged your audience is with your content. A high bounce rate suggests that visitors are leaving your site quickly, while a longer time on site indicates that they are finding your content valuable. Analysing these metrics can help you identify areas for improvement and increase user engagement.

Identifying Trends and Patterns
Seasonal Variations
Seasonal variations can have a significant impact on your AdSense performance. For example, retail sites may see a spike in traffic and revenue during the holiday season, while travel sites may experience increased activity in the summer. Identifying these patterns can help you plan your content and ad strategy accordingly.
Content Performance Over Time
Tracking the performance of your content over time can reveal valuable insights into what works and what doesn’t. Look at metrics such as page views, CTR, and revenue for individual pages to identify high-performing content. Use this information to inform your future content strategy and replicate successful elements.
High-Performing Pages
High-performing pages are those that generate significant traffic and revenue. Analysing these pages can help you understand what makes them successful and apply those insights to other areas of your site. Look at factors such as content quality, keyword usage, and ad placement to identify the key drivers of performance.
Optimising AdSense Revenue
A/B Testing for Ad Placement
A/B testing involves comparing two versions of a page or ad to see which one performs better. Use A/B testing to experiment with different ad placements and configurations. This process can help you identify the most effective ad placements and optimise your site for maximum revenue.
Improving Ad Relevance
Ad relevance is crucial for attracting clicks and generating revenue. Ensure that your ads are relevant to your content and audience by using targeted keywords and ad formats. Regularly review and update your ad settings to maintain relevance and improve performance.
Enhancing User Experience
A positive user experience is essential for maintaining high traffic and engagement. Ensure that your site is easy to navigate, loads quickly, and provides valuable content. Avoid overloading your site with ads, as this can negatively impact user experience and lead to higher bounce rates.
Also, Read – How to Optimize Your Website for Mobile Users
Common Pitfalls and How to Avoid Them
Misinterpreting Data
One of the biggest challenges in analysing AdSense reports is misinterpreting the data. Ensure that you understand what each metric represents and how it relates to your overall performance. Take the time to educate yourself on the nuances of AdSense reporting to avoid common pitfalls.
Ignoring External Factors
External factors such as changes in Google algorithms, industry trends, and economic conditions can impact your AdSense performance. Stay informed about these factors and consider them when analysing your data. This will help you make more accurate and informed decisions.
Overlooking Small Changes
Small changes can have a big impact on your AdSense performance. Regularly review your reports to identify subtle trends and patterns. Pay attention to even the smallest changes, as they can provide valuable insights and help you optimise your strategy.
Conclusion
Analysing and interpreting AdSense performance reports is a crucial skill for any website owner looking to maximise their ad revenue. By understanding key metrics, customising reports, and regularly monitoring your performance, you can turn data into actionable insights. Remember, the goal is not just to increase your earnings, but also to provide a positive user experience. Stay informed, stay proactive, and keep refining your strategy to achieve long-term success with AdSense.
FAQs
What is the best way to increase my CTR?
To increase your Click-Through Rate (CTR), focus on improving the relevance and placement of your ads. Experiment with different ad formats, sizes, and positions to find what works best for your audience. Additionally, ensure that your content is engaging and aligns with the interests of your visitors.
How often should I review my AdSense reports?
It’s recommended to review your AdSense reports at least once a week. Regular monitoring allows you to identify trends and make timely adjustments. However, the frequency may vary depending on your site’s traffic and the level of optimisation you’re aiming for.
Can I rely solely on AdSense reports for website analytics?
While AdSense reports provide valuable insights into your ad performance, it’s important to use them in conjunction with other analytics tools like Google Analytics. This will give you a more comprehensive understanding of your site’s overall performance and user behaviour.
How do I interpret sudden drops in revenue?
Sudden drops in revenue can be caused by various factors, including changes in traffic, ad relevance, or external conditions. Analyse your reports to identify any significant changes in key metrics. Additionally, consider external factors such as seasonal trends or updates to Google’s algorithms.
Are there tools to help me analyse AdSense data more effectively?
Yes, several tools can help you analyse AdSense data more effectively. Google Analytics, for example, provides detailed insights into your site’s traffic and user behaviour. Additionally, third-party tools like SEMrush and Ahrefs can offer valuable data and analysis.
What external factors can affect my AdSense performance?
External factors such as changes in Google’s algorithms, industry trends, and economic conditions can impact your AdSense performance. Stay informed about these factors and consider them when analysing your data. This will help you make more accurate and informed decisions.
How can I improve the quality of traffic to my site?
To improve the quality of traffic to your site, focus on creating high-quality, relevant content that appeals to your target audience. Utilise SEO best practices to increase your site’s visibility in search engine results. Additionally, engage with your audience through social media and other channels to attract more targeted traffic.